This article studies the rupture of the Keur Bara KAIRE dike, located in the commune of Notto Diobasse in the department of Thiès in Senegal. The village is crossed by a stream which collects rainwater from the west to the east, following a natural slope. The overflow of this stream causes serious flooding, leading to the total cutting of the road and the isolation of the population. These floods had tragic consequences, resulting in two losses of human life. To regulate the water level, prevent flooding and protect agricultural and urban areas from overflows, the Senegalese authorities initiated the project to build the Keur Bara KAIRE dike in 2004, unfortunately the latter gave way in 2017. The geotechnical analysis was carried out on samples taken from various points on the site, revealing that the terrain is mainly composed of fine sand and the embankment is made with clayey sand. Morphometric and hydrological investigations highlight that the watershed of the Keur Bara KAIRE dike covers an area of 3.72 km², with a projected flow of 54.99 m³/s. The resizing of the dike revealed the following data: a length of 132 meters and a height of 3 meters. The spillway is 52.99 meters long with a reservoir height of 1.22 meters. The bay walls have a thickness of 50 cm and the embankments have a slope of ½ upstream and downstream. The stability calculation on the broken dike reveals a sliding safety factor (FSG) of 1.84 which complies with the standard and an overturning safety factor (FSR) of 0.13 which is not verified. The surface of the watershed which is equal to 3.72 km², also the smallest height of precipitation is equal to 234.9 mm and the largest 664.4 mm, the ORSTOM and CIEH methods for hydraulic calculations.
| Published in | Journal of Civil, Construction and Environmental Engineering (Volume 9, Issue 6) |
| DOI | 10.11648/j.jccee.20240906.13 |
| Page(s) | 197-210 |
| Creative Commons |
This is an Open Access article, distributed under the terms of the Creative Commons Attribution 4.0 International License (http://creativecommons.org/licenses/by/4.0/), which permits unrestricted use, distribution and reproduction in any medium or format, provided the original work is properly cited. |
| Copyright |
Copyright © The Author(s), 2024. Published by Science Publishing Group |
Keur Bara KAIRE, Dike, Geotechnical, Topography Surveys, Watershed, Stability
Permeability classes depending on the permeability coefficient | K (m/s) | Degree of permeability |
|---|---|---|
Medium to large gravels | 10-1 – 10-3 | Very high |
Small Gravel, Sand | 10-3 – 10-5 | Quite high |
Very fine Sand, silt sand, lœss | 10-5 – 10-7 | Weak |
Compact silt, clay, loam | 10-7 – 10-9 | Very weak |
Frank clay | 10-9 – 10-12 | Vitually waterproof |
Classification according to natur | Classification according to water status | ||||
|---|---|---|---|---|---|
nature parameters First level of classification | Class | nature parameters Second level of classification | Subclass function of nature | Status Settings | State function subclass |
Dmax≤50mm and Sieve at 80µm>35% | A Sols fins | VBS ≤2,5 ou Ip≤12 | A1 Little plastic silts, loess, alluvial silts, little polluted fine sands, little plastic arenas | IPL≤3 ou Wn≥1,25WOPN | A1th |
3<IPL≤8 ou 1,10≤Wn<1,25 WOPN | A1h | ||||
8<IPL≤25 ou 0,9WOPN≤Wn<1,1WOPN | A1m | ||||
0,7WOPN≤Wn<0,9WOPN | A1s | ||||
Wn<0,7 WOPN | A1ts | ||||
12<Ip≤25 ou 2,5<VBS≤6 | A2 Fine clay sands, clay silts and poorly plastic marls, arenas | IPL≤2 ou Ic≤0,9 ou Wn≥1,3WOPN | A2th | ||
2<IPL≤5 ou 0,9≤Ic<1,05 ou 1,1WOPN≤Wn<1,3 WOPN | A2h | ||||
5<IPL<15 ou 1,05<Ic≤1,2 ou 0,9WOPN≤Wn<1,1WOPN | A2m | ||||
1,2<Ic≤1,4 ou 0,7 WOPN≤Wn<0,9WOPN | A2s | ||||
Ic>1,3 ou Wn<0,7WOPN | A2ts | ||||
25<Ip≤40 ou 6<VBS≤8 | A3 Clays and marly clays, very plastic silts | IPL<1 ou Ic≤0,8 ou Wn≥1,4WOPN | A3th | ||
1<IPL<3 ou 0,8≤Ic<1 ou 1,2WOPN≤Wn<1,4 WOPN | A3h | ||||
3<IPL<10 ou 1<Ic≤1,15 ou 0,9WOPN≤Wn<1,2 WOPN | A3m | ||||
1,15<Ic≤1,3 ou 0,7 WOPN≤Wn<0,9WOPN | A3s | ||||
Ic>1,3 ou Wn<0,7WOPN | A3ts | ||||
Ip>40 ou VBS>8 | A4 Very plastic clays and marly clays | Threshold values of state parameters, to be defined in support of a specific study | A4th | ||
A4h | |||||
A4m | |||||
A4s | |||||
CLASSIFICATION TO USE FOR EMPLOYMENT CLASSIFICATION TO USE FOR SHAPE LAYERS | |||||||
|---|---|---|---|---|---|---|---|
CLASSIFICATION ACCORDING TO NATURE | CLASSIFICATION ACCORDING TO WATER STATUS | CLASSIFICATION BY BEHAVIOR | |||||
nature parameters First level of classification | Class | nature parameters Second level of classification | Subclass function of nature | Status Settings | State function subclass | behavior settings | Subclass behavior function |
Dmax≤50mm et Sieve at 80µm≤35% | B Sols sableux et argileux avec fines | Sieve at 80µm≤12% Sieve at 2mm>70%0, 1≤VBS≤0,2 | B1 silite sands | Materials generally insensitive to water | FS≤60 FS>60 | B11 B12 | |
Sieve at 80µm≤12% Sieve at 2mm>70% VBS>0,2 | B2 Clayey sands (lightly clayey) | IPL≤4 ou Wn≥1, 25WOPN | B2 th | FS≤60 | B21 th | ||
FS>60 | B22 th | ||||||
4<IPL≤8 ou 1,10≤Wn<1, 25 WOPN | B2 h | FS≤60 | B21 h | ||||
FS>60 | B22 h | ||||||
0,9WOPN≤Wn<1, 10WOPN | B2 m | FS≤60 | B21 m | ||||
FS>60 | B22 m | ||||||
0,5WOPN≤Wn<0, 9WOPN | B2 s | FS≤60 | B21 s | ||||
FS>60 | B22 s | ||||||
Wn<0,5WOPN | B2 ts | FS≤60 | B21 ts | ||||
FS>60 | B22 ts | ||||||
Sieve at 80µm≤12% Sieve at 2mm>70%0, 1≤VBS≤0,2 | B3 Silty gravel | Materials generally insensitive to water | LA≤45 et MIDE≤45 | B31 | |||
LA>45 et MIDE>45 | B32 | ||||||
Watershed characteristics | Results obtained |
|---|---|
Area S in km² | 3,72 |
Perimeter P in km | 10,43 |
Maximum altitude in m | 104 |
Minimum altitude in m | 82 |
Hydraulic length in km | 2,54 |
Average slope | 0,63 |
Shape index KG | 1,52 |
Length of the equivalent rectangle L in km | 4,37 |
Overall slope index Ig in m/km | 5,98 |
Specific height difference Ds in m | 11,54 |
Basin typology | Very small watershed |
Relief typology | Weak |
Samples | Curvature coefficient (Cc) | Uniformity coefficient (Cu) |
|---|---|---|
Upstream S1 | 4,20 | 6,20 |
Upstream S2 | 6,30 | 10,17 |
Upstream S3 | 4,65 | 8,33 |
Downstream S1 | 0,39 | 4,62 |
Downstream S2 | 0,55 | 4,88 |
Downstream S3 | 0,39 | 4,62 |
Embankment of the dike | 1,15 | 4,62 |
Samples | γs moyen (g/ml) |
|---|---|
Upstream S3 | 2,649 |
Downstream S1 | 2,622 |
Downstream S2 | 2,927 |
Downstream S3 | 2,653 |
Embankment of the dike | 2,613 |
Samples | VBS |
|---|---|
Upstream S3 | 1,12 |
Downstream S1 | 0,71 |
Downstream S2 | 0,71 |
Downstream S3 | 0,56 |
Embankment of the dike | 0,81 |
Samples | Sand equivalent |
|---|---|
Upstream S3 | 27,07 |
Downstream S1 | 27,06 |
Downstream S2 | 42,27 |
Downstream S3 | 42,21 |
Embankment of the dike | 53,45 |
Samples | Hint | |
|---|---|---|
Upstream S1 | Ip | 17,8 |
Ic | 2,21 | |
Upstream S2 | Ip | 25,6 |
Ic | 1,38 | |
Overload (kg) | σn (kPa) | τ (kPa) |
|---|---|---|
4 | 237,819 | 87,582 |
8 | 514,370 | 305,999 |
16 | 1023,195 | 282,611 |
Cohesion | C(kPa) | 0 |
|---|---|---|
Internal friction angle | φ (°) | 21,82 |
(écart type) | a | moyenne | X0 | s |
|---|---|---|---|---|
65,841 | 0,019 | 200,906 | 171,274 | 51,356 |
(écart type) | moyenne | s | X0 |
|---|---|---|---|
65,841 | 200,906 | 51,356 | 171,274 |
A | 0,91 |
P10 | 286,844 |
P100 | 407,521 |
Kr10 | 24 |
Pan | 441,24 |
S | 3,72 |
| 2,6 |
Tb10 | 440 |
Qr10 (m3/s) | 23,17 |
Pan | 441,24 |
S | 3,72 |
Ig | 5,98 |
Q10 (m3/s) | 13,86 |
Q10 (m3/s) | C | Q100 (m3/s) | |
|---|---|---|---|
ORSTOM | 23,17 | 2,37 | 54,99 |
CIEH | 13,86 | 32,89 |
Ridge width Lc (m) | 7,02 |
Width of the base of the dike Lb (m) | 58,8 |
Height of the dike H (m) | 2,88 |
Water Slide h (m) | 0,7 |
Height of the reservoir Hr (m) | 2,27 |
Length of weir (m) | 30,00 |
Wind speed (u in km/h) | 15,24 |
TN Rating (m) | 75,06 |
Lengths of the (m) | 132 |
FETCH Length (Lf in m) | 0,12 |
Wave height (Hv in m) | 0,79 |
Wave propagation speed ( v in m/s) | 3,09 |
Revenge (R in m) | 1,08 |
Height of the dike (Hd in m) | 3,00 |
Ridge width (Lc in m) | 2,86 |
Width of the base of the dike (Lb in m) | 14,86 |
Water Gap (h in m) | 0,70 |
Height of the reservoir (Hr in m) | 1,22 |
Flow coefficient (m) | 0,40 |
Project flood (Q in m3/s) | 54,99 |
Spillway length (L in m) | 52,99 |
Lv (m) | LH (m) | C | Hr (m) |
|
|---|---|---|---|---|
58,81 | 132 | 7 | 1,22 | vérifié |
Y | Pente | C | V (m/s) | e (m) |
|---|---|---|---|---|
2,8 | 1/2 | 0,026 | 3,09 | 0,24 |
W1 | U | Pa | FSG |
|---|---|---|---|
179,69 | 205,8 | 2,45 | 1,84 |
∑M Stabilizers | 530,39 |
∑M Stunning | 4035,53 |
FSR | 0,13 |
Peak Width (m) | 2,86 |
Height of the wall above the TN (m) | 3 |
Wall thickness (m) | 0,5 |
Length of the anti-fox screen (m) | 1 |
Slope of side walls | 1/2 (Upstream and downstream) |
°C | Degree Celsius |
ANACIM | National Agency for Civil Aviation and Meteorology |
ANSD | National Agency for Statics and Demography |
Cc | Curvature Coefficient |
CIEH | Inter-African Committee for Hydraulic Studies |
cm | Centimeter |
Cu | Uniformity Coefficient |
D10 | Sieve Diameter Corresponding to 10% |
D30 | Sieve Diameter Corresponding to 30% |
D60 | Sieve Diameter Corresponding to 60% |
Dd | Drainage Density |
Ds | Specific Elevation |
ES | Sand Equivalent |
Fd | Exceeding Frequency |
Fnd | Frequency of Non-exceeding |
FSG | Slip Safety Factor |
FSR | Rollover Safety Factor |
GNSS | Global Navigation Satellite Systems |
GPS | Global Positioning System |
GTR | Guide to Road Earthworks |
HD | Height of the Dike |
Hr | Height of the Reservoir |
Ic | Consistency Index |
Ig | Overall Slope Index |
Ip | Plasticity Index |
k | Permeability Coefficient |
KG | Shape Index |
Km | Kilometer |
km² | Square Kilometer |
L | Length of the Equivalent Rectangle |
Lb | Base Width of the Dike |
Lc | Ridge Width |
m | Meter |
DEM | Digital Terrain Model |
MRUH | Ministry of Urban Renewal and Housing |
NF | French Standard |
ORSTOM | Overseas Scientific and Technical Research Office |
P | Perimeter of the Watershed |
P10 | Ten-year Daily Rain |
P100 | 100-year Daily Rain |
PVC | Polyvinyl Chloride |
Q100 | Centennial Flow or Design Flood |
Qr10 | Ten-year Flow |
A | Free Revenge |
s | Second |
S | Watershed Area |
T | Return Period |
TN | Natural Terrain |
U | Reduced Gumbel Variable |
UFR-SI | Engineering Sciences Training and Research Unit |
VBS | Methylene Blue Value |
w | Water Content |
WL | Liquidity Limit |
WP | Plasticity Limit |
Zd | Setting Dimension |
| [1] | ANSD, «Projection of the population of the Thiès region» 2022. |
| [2] | C. Sophie and L. Jean, “Drinking water service: From the logic of supply to the control of demand,” Jwarp, 1996. Concrete dikes. [Performance]. 2020. |
| [3] | I. SEYE, Design of a rainwater sanitation network integrated into a geographic information system in the Sampathé district, Thiés: UFR SI, 2019, p. 9. |
| [4] | C. MERLIN, “Drinking Supply Project for Cities in the Central and Coastal Zone. Dakar,” (July 2010). |
| [5] | S. Faye, “Hydrodynamic modeling of the aquifers of the northern coast between Kayar and Saint-Louis. Impact of future withdrawals envisaged within the framework of the water supply of Dakar and its surroundings,” Dakar, 1995. |
| [6] | B. Igor and G. Didier, “Tool to aid in the diagnosis of the drinking water network for the city of Chisinau by spatial and temporal analysis of hydraulic dysfunctions,” jwarp, 2004. |
| [7] | M. AVERETTE, 2005. [Online]. Available: |
| [8] | SETICO/CONCEPT, “Possible variants of water resource mobilization,” 2013. |
| [9] | C. M. S. SONES, “Mobilization of alternative water resources for irrigation in the Dakar region. 79 p.,” 2007. |
| [10] | M. D. KHOUSSA, “Study of the dike,” at Hydrological Analysis-Diagnostic of the Sibidiang dam in the commune of Medina Gounass, UFR-SET, 2020, p. 60. |
APA Style
Camara, N., Niane, B., Tamba, S. (2024). Solution to the Breach of the Dike of Keur Bara KAIRE, Located in the Commune of Notto Diobasse in the Department of Thiès, Senegal. Journal of Civil, Construction and Environmental Engineering, 9(6), 197-210. https://doi.org/10.11648/j.jccee.20240906.13
ACS Style
Camara, N.; Niane, B.; Tamba, S. Solution to the Breach of the Dike of Keur Bara KAIRE, Located in the Commune of Notto Diobasse in the Department of Thiès, Senegal. J. Civ. Constr. Environ. Eng. 2024, 9(6), 197-210. doi: 10.11648/j.jccee.20240906.13
AMA Style
Camara N, Niane B, Tamba S. Solution to the Breach of the Dike of Keur Bara KAIRE, Located in the Commune of Notto Diobasse in the Department of Thiès, Senegal. J Civ Constr Environ Eng. 2024;9(6):197-210. doi: 10.11648/j.jccee.20240906.13
@article{10.11648/j.jccee.20240906.13,
  author = {Ndiouga Camara and Birane Niane and Séni Tamba},
  title = {Solution to the Breach of the Dike of Keur Bara KAIRE, Located in the Commune of Notto Diobasse in the Department of Thiès, Senegal
},
  journal = {Journal of Civil, Construction and Environmental Engineering},
  volume = {9},
  number = {6},
  pages = {197-210},
  doi = {10.11648/j.jccee.20240906.13},
  url = {https://doi.org/10.11648/j.jccee.20240906.13},
  eprint = {https://article.sciencepublishinggroup.com/pdf/10.11648.j.jccee.20240906.13},
  abstract = {This article studies the rupture of the Keur Bara KAIRE dike, located in the commune of Notto Diobasse in the department of Thiès in Senegal. The village is crossed by a stream which collects rainwater from the west to the east, following a natural slope. The overflow of this stream causes serious flooding, leading to the total cutting of the road and the isolation of the population. These floods had tragic consequences, resulting in two losses of human life. To regulate the water level, prevent flooding and protect agricultural and urban areas from overflows, the Senegalese authorities initiated the project to build the Keur Bara KAIRE dike in 2004, unfortunately the latter gave way in 2017. The geotechnical analysis was carried out on samples taken from various points on the site, revealing that the terrain is mainly composed of fine sand and the embankment is made with clayey sand. Morphometric and hydrological investigations highlight that the watershed of the Keur Bara KAIRE dike covers an area of 3.72 km², with a projected flow of 54.99 m³/s. The resizing of the dike revealed the following data: a length of 132 meters and a height of 3 meters. The spillway is 52.99 meters long with a reservoir height of 1.22 meters. The bay walls have a thickness of 50 cm and the embankments have a slope of ½ upstream and downstream. The stability calculation on the broken dike reveals a sliding safety factor (FSG) of 1.84 which complies with the standard and an overturning safety factor (FSR) of 0.13 which is not verified. The surface of the watershed which is equal to 3.72 km², also the smallest height of precipitation is equal to 234.9 mm and the largest 664.4 mm, the ORSTOM and CIEH methods for hydraulic calculations.
},
 year = {2024}
}
TY  - JOUR
T1  - Solution to the Breach of the Dike of Keur Bara KAIRE, Located in the Commune of Notto Diobasse in the Department of Thiès, Senegal

AU  - Ndiouga Camara
AU  - Birane Niane
AU  - Séni Tamba
Y1  - 2024/11/28
PY  - 2024
N1  - https://doi.org/10.11648/j.jccee.20240906.13
DO  - 10.11648/j.jccee.20240906.13
T2  - Journal of Civil, Construction and Environmental Engineering
JF  - Journal of Civil, Construction and Environmental Engineering
JO  - Journal of Civil, Construction and Environmental Engineering
SP  - 197
EP  - 210
PB  - Science Publishing Group
SN  - 2637-3890
UR  - https://doi.org/10.11648/j.jccee.20240906.13
AB  - This article studies the rupture of the Keur Bara KAIRE dike, located in the commune of Notto Diobasse in the department of Thiès in Senegal. The village is crossed by a stream which collects rainwater from the west to the east, following a natural slope. The overflow of this stream causes serious flooding, leading to the total cutting of the road and the isolation of the population. These floods had tragic consequences, resulting in two losses of human life. To regulate the water level, prevent flooding and protect agricultural and urban areas from overflows, the Senegalese authorities initiated the project to build the Keur Bara KAIRE dike in 2004, unfortunately the latter gave way in 2017. The geotechnical analysis was carried out on samples taken from various points on the site, revealing that the terrain is mainly composed of fine sand and the embankment is made with clayey sand. Morphometric and hydrological investigations highlight that the watershed of the Keur Bara KAIRE dike covers an area of 3.72 km², with a projected flow of 54.99 m³/s. The resizing of the dike revealed the following data: a length of 132 meters and a height of 3 meters. The spillway is 52.99 meters long with a reservoir height of 1.22 meters. The bay walls have a thickness of 50 cm and the embankments have a slope of ½ upstream and downstream. The stability calculation on the broken dike reveals a sliding safety factor (FSG) of 1.84 which complies with the standard and an overturning safety factor (FSR) of 0.13 which is not verified. The surface of the watershed which is equal to 3.72 km², also the smallest height of precipitation is equal to 234.9 mm and the largest 664.4 mm, the ORSTOM and CIEH methods for hydraulic calculations.

VL  - 9
IS  - 6
ER  -
Geotechnical Department, UFR Engineering Sciences, Iba Der THIAM University of Thiès, Thiès, Sénégal
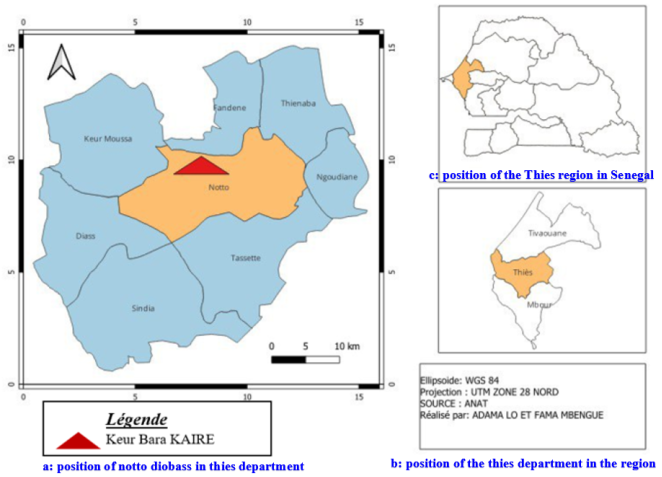
Figure 1. Geographical location of the study area on Qgis.

Figure 2. Delimitation of the study area on Google Earth.
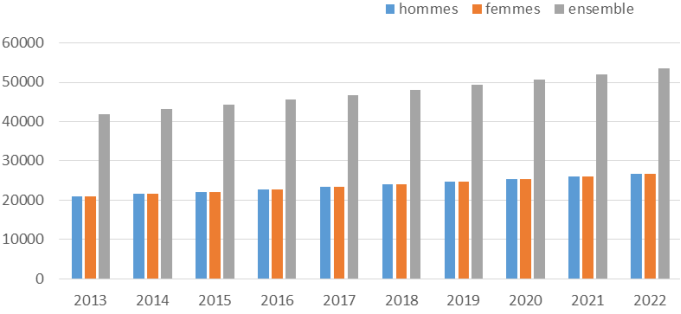
Figure 3. The evolution of the demographics of the municipality.
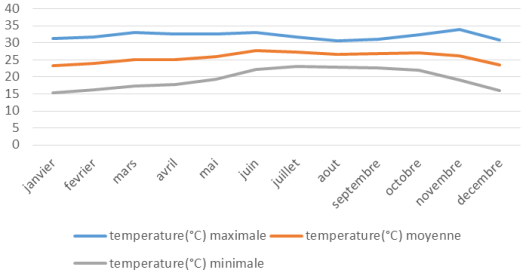
Figure 5. Variation of monthly temperature in the Thies region in 2018 [5].
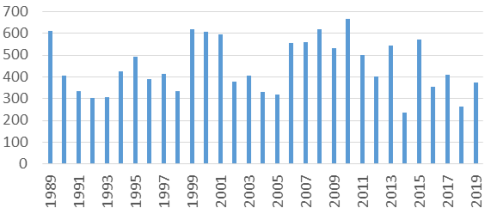
Figure 6. Variation in the average annual rainfall of Thiès from 1989 to 2019 [1].
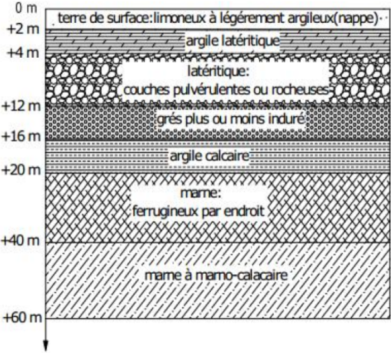
Figure 7. Geological section of Thiès [6].
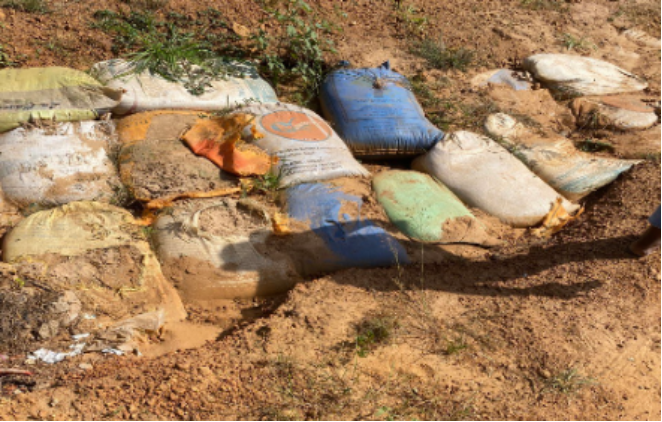
Figure 8. Sandbags stored on the track ditch.
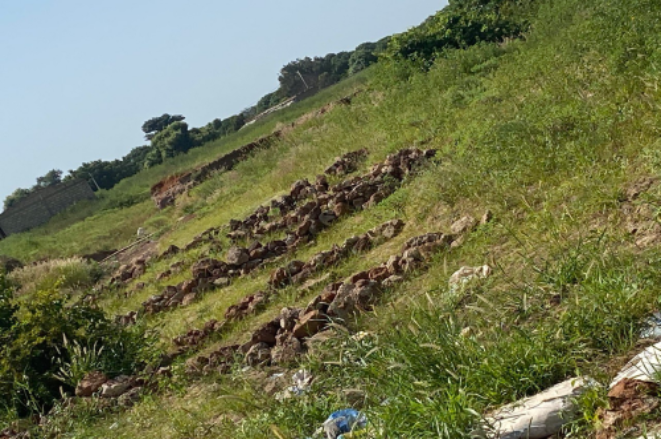
Figure 9. Rows of rocks to reduce wave pressure.
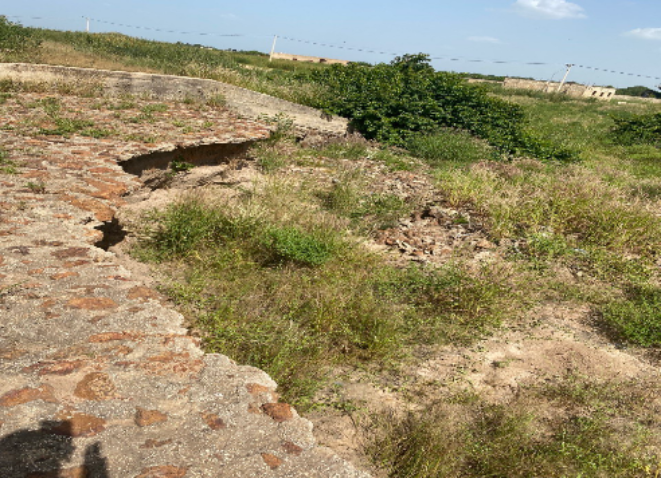
Figure 10. Rupture at the down stream slop.
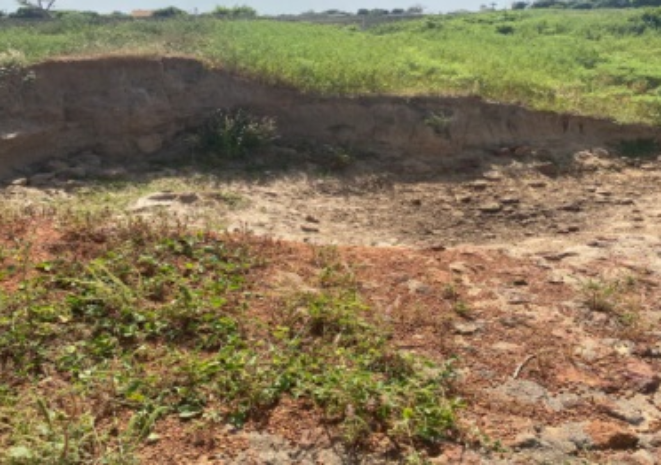
Figure 11. Rupture at the spillway.
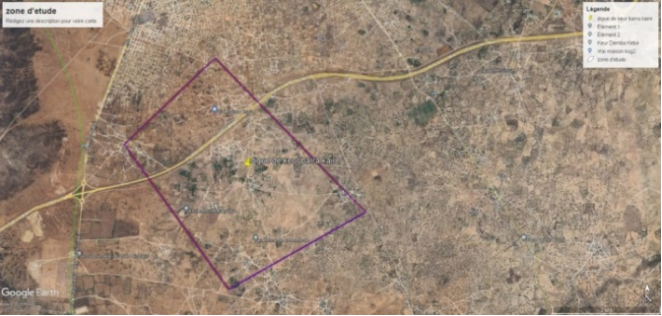
Figure 12. Zoning for watershed delimitation on Google Earth pro.
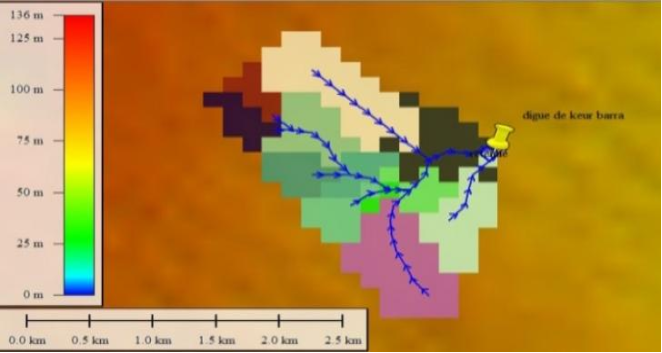
Figure 13. Demarcation of the sub-watersheds of Keur Bara KAIRE on Global Mapper.
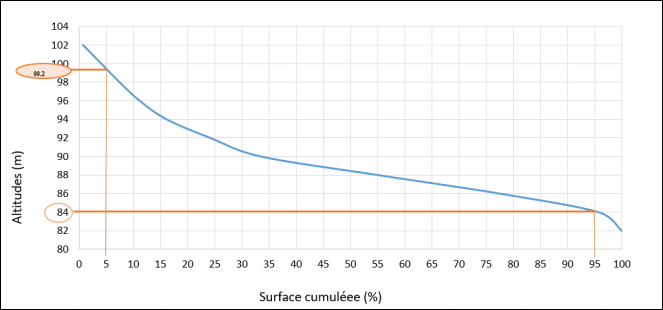
Figure 14. Hypsometric curve of the Keur Bara KAIRE watershed.
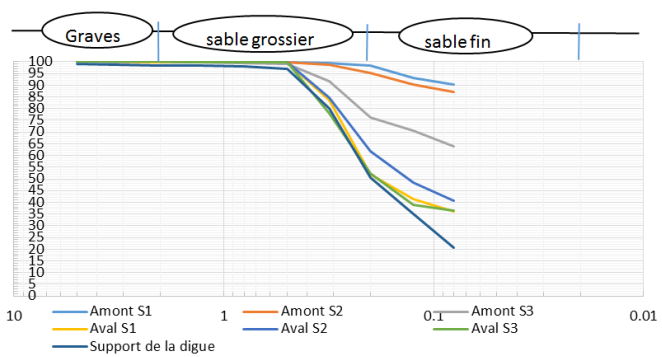
Figure 15. Particle size curves on the seven (7) samples.
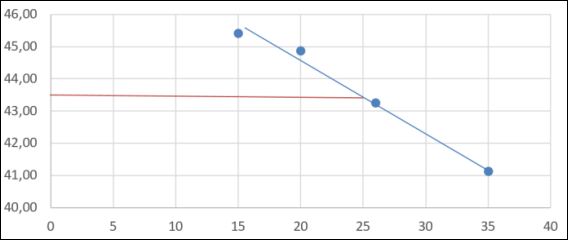
Figure 16. Curve of the liquidity limit of the upstream S1 sample.
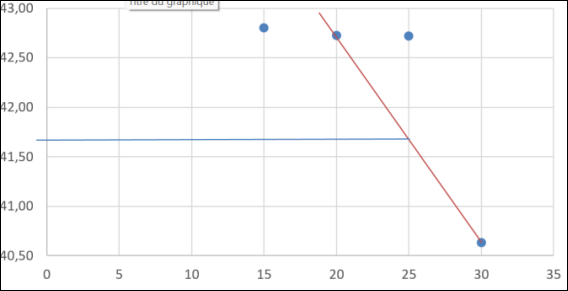
Figure 17. Curve of the liquidity limit of the upstream S2 sample.

Figure 18. Shear force-strain curve.
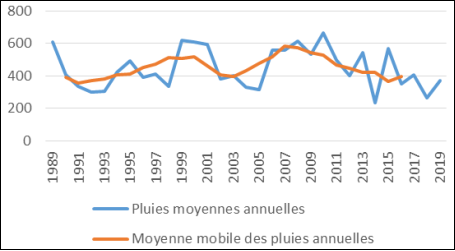
Figure 19. Variation in the moving average of annual rainfall.
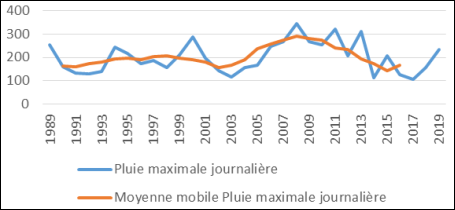
Figure 20. Variation in the moving average of daily maximum rainfall.
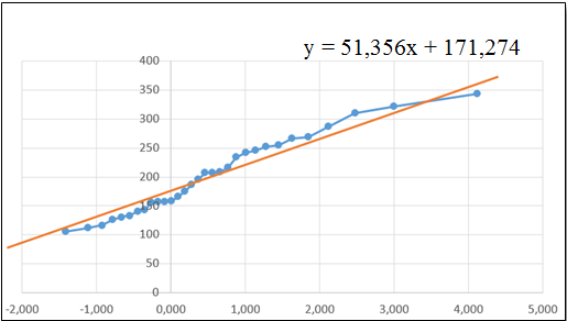
Figure 21. Graphical adjustment of daily maximum rainfall.